Debug an extension
Building and debugging a WindowSill extension is a straightforward process. This guide will walk you through the necessary steps.
Build & Run
First, open the project your created in the previous page in your favorite IDE or text editor (Visual Studio, Visual Studio Code or JetBrains Rider).
Then, you should simply be able to press F5 to start the debugger. Your project will build, then WindowSill will start (or restart if it was already running), and your extension will be loaded. The MyExtension sill will appear as soon as you start Notepad on your machine and give it the focus.
In the next section, we will dive more into how this works and how to create your own sill.
Troubleshooting
If it fails to build and run, here are a few points to verify:
- Ensure WindowSill is installed. If you just installed WindowSill Pro (using installer instead of Microsoft Store), you may need to restart your computer before being able to debug.
- In the
csproj, ensure you set aPackageIdandVersiontags inPropertyGroup. - Ensure that in Visual Studio, your extension builds as x64 (instead of Any CPU) and
WindowSill Extensionis selected as debugging mode.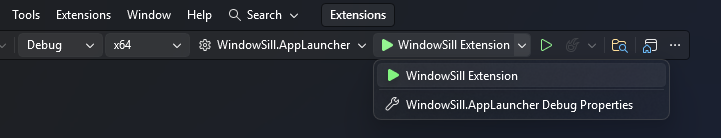
- If Visual Studio complains it can't find
windowsill.exe, try to either reinstall WindowSill, restart your computer, or set an absolute path to WindowSill.exe inProperties/launchSettings.jsonin your project.